
The progression of Duchenne muscular dystrophy has long been viewed as a series of inevitable but unpredictable milestones, leaving families in a state of perpetual uncertainty regarding the preservation of mobility. The loss of ambulation in Duchenne muscular dystrophy represents a pivotal clinical juncture that often triggers a rapid decline in respiratory and cardiac health while diminishing a patient’s physical and social quality of life. For decades, the medical community struggled to provide precise timelines for this transition, as the rate of muscle decay varies significantly from one child to another based on genetic nuances and treatment responses. However, as of 2026, the landscape of prognostic medicine has shifted toward a more personalized approach. By leveraging the power of machine learning, researchers have developed tools that go beyond generalized population statistics to offer families a clearer vision of their specific journey. This evolution from reactive care to proactive planning is essential for improving long-term outcomes and ensuring that interventions are timed with surgical precision to maintain the highest possible quality of life for those affected.
Developing a Data-Driven Predictive Model
Methodology and Participant Selection
The foundation of this breakthrough rests upon a comprehensive longitudinal study that followed 188 boys diagnosed with Duchenne muscular dystrophy. This cohort was observed over a median period of nearly four years, during which researchers meticulously documented the transition from independent walking to the reliance on assistive mobility devices. The study was designed to be as robust as possible, excluding patients who were already receiving cutting-edge disease-modifying therapies such as gene therapy or exon skipping. This exclusion was necessary to establish a clear baseline of disease progression in the current standard-of-care environment. By focusing on a genetically and pathologically confirmed population, the researchers ensured that the data driving the machine learning algorithm was grounded in the biological reality of the condition, rather than being skewed by external therapeutic variables that might mask the natural decay of muscle fibers over time.
To ensure the resulting model, known as DMD-TIMER, was capable of functioning in diverse clinical settings, the participant pool was divided into two distinct groups. A training set consisting of 148 patients was used to teach the algorithm how to recognize the complex patterns leading up to the loss of ambulation. Meanwhile, an independent test set of 40 patients was reserved to validate the model’s accuracy, essentially serving as a real-world simulation to see how the tool would perform when faced with entirely new data. This rigorous separation is a hallmark of high-quality machine learning development, as it prevents the model from simply “memorizing” the training data and instead forces it to learn the underlying physiological signals of muscle failure. The balanced demographics and clinical parameters between these two groups provided a reliable framework for developing a survival-analysis algorithm that clinicians can trust to deliver actionable insights during routine patient evaluations.
Selecting the Most Informative Features
The process of refining the predictive model required a sophisticated approach to data selection, moving past the thousands of potential variables to find the handful of factors that truly dictate a patient’s mobility timeline. Researchers employed a multi-stage dimensionality reduction process, utilizing techniques like LASSO regression and the Boruta algorithm to strip away statistical noise. They evaluated a wide array of clinical markers, ranging from the North Star Ambulatory Assessment (NSAA) scores to manual muscle testing percentages and the age of the patient. The goal was to identify a synergy between how a patient performs in a physical exam and what is actually happening within their muscle tissue at a cellular level. This careful filtering process revealed that while many functional tests provide a snapshot of current ability, they do not always capture the hidden structural damage that precedes a functional collapse, necessitating a deeper look into the muscle’s physical state.
Surprisingly, when evaluating various imaging parameters, the algorithm prioritized specific fat fraction measurements over more traditional metrics like T1 and T2 relaxation times. While T1 and T2 mapping can indicate inflammation and edema, these factors are often fluctuating and potentially reversible, making them less reliable for long-term forecasting. In contrast, fat fraction serves as an irreversible hallmark of muscle replacement by fibrotic tissue. The final model focused on three critical muscle groups: the rectus femoris, the vastus lateralis, and the obturator internus. The inclusion of the obturator internus was a significant revelation, as this hip-stabilizing muscle had previously been overlooked in standard clinical assessments. By identifying these specific biological “red flags,” the researchers were able to construct a model that captures the early, silent stages of muscle decay that traditional physical therapy evaluations might miss until the patient is already at high risk of losing their independence.
The Power of Quantitative Imaging and Algorithms
The Role of Fat Fraction as a Biological Marker
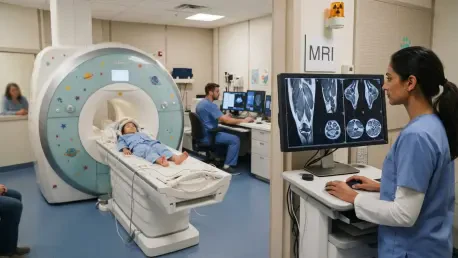
Quantitative magnetic resonance imaging (qMRI) has emerged as the definitive tool for uncovering the “ground truth” of muscle health in Duchenne muscular dystrophy. The fat fraction (FF) metric provides a direct percentage of how much healthy muscle has been replaced by fatty infiltration, a process that is central to the pathology of the disease. In the DMD-TIMER study, the use of a 3-tesla scanner allowed for incredibly precise measurements of these shifts across 19 different muscles. Unlike functional tests, which can be influenced by a child’s motivation, fatigue, or daily energy levels, the fat fraction offers an objective and stable measurement of disease progression. This objectivity is vital because it allows clinicians to see past a patient’s outward performance, which may appear stable even as the underlying muscle architecture is rapidly deteriorating toward a critical failure point.
The research established clear inflection points for fat fraction that signal an imminent loss of ambulation. For example, once the fat fraction in the rectus femoris reaches approximately 32.3%, the risk of transitioning to a wheelchair increases significantly. Similarly, the vastus lateralis showed a threshold near 58%, marking a point where the muscle’s functional capacity can no longer compensate for the structural damage. These specific numerical targets provide clinicians with a concrete way to monitor the effectiveness of treatments and the rate of decline. By tracking these values over time, starting from 2026 and moving through subsequent years, medical teams can visualize the narrowing window of mobility. This shift toward quantitative imaging represents a move away from the “wait and see” approach that has historically dominated DMD care, replacing it with a data-driven strategy that prioritizes early intervention and realistic expectation management for families.
Assessing Machine Learning Model Performance
The true strength of the DMD-TIMER tool lies in its underlying Random Survival Forest (RSF) architecture, which was found to be superior to traditional linear models like the Cox proportional hazards model. The RSF approach is uniquely suited for medical data because it does not assume that the relationship between risk factors and the final outcome is a straight line. Instead, it utilizes an ensemble of 1,000 decision trees to explore the complex, non-linear interactions between age, physical strength, and muscle fat levels. In the training phase, this model achieved a concordance index of 0.932, a remarkably high score that indicates an exceptional ability to rank patients correctly based on their risk level. This performance was not limited to the training environment; even when applied to the independent test group, the model maintained high accuracy, proving that the patterns it identified were universal across the DMD population.
In addition to its high concordance index, the model demonstrated exceptional predictive power across various time horizons, with the area under the curve (AUC) remaining above 0.96 for predictions at 12, 24, 36, and 48 months. This longitudinal reliability is crucial for families who need to make long-term life decisions, such as when to renovate a home for accessibility or when to transition to a more aggressive steroid regimen. The model’s ability to maintain its accuracy even up to four years out from the initial scan provides a level of foresight that was previously unattainable. While accuracy naturally showed a slight decline at the most distant 48-month mark, the tool still provided a much more reliable forecast than any single functional test or clinical observation could offer on its own. This technical success underscored the necessity of integrating advanced computational methods into the field of neuromuscular medicine to solve problems that are too complex for human observation alone.
Practical Clinical Application and Future Outlook
Risk Stratification: Understanding the Survival Curves
To make the complex outputs of a machine learning algorithm useful for everyday clinical practice, the researchers organized the data into a risk stratification system based on tertiles. This categorized patients into low, intermediate, and high-risk groups, each with a distinct survival curve that visualizes the probability of maintaining ambulation over time. The results were stark: in the study group, no patients in the low-risk category lost their ability to walk during the follow-up window, while nearly 88% of those in the high-risk group reached that endpoint. This clear separation of outcomes allows doctors to prioritize their most vulnerable patients and adjust care plans accordingly. By providing a visual representation of risk, the tool helps bridge the communication gap between medical professionals and families, making the abstract concept of “disease progression” tangible and understandable.
To further enhance the transparency of the “black box” algorithm, the study utilized SHAP values, which explain exactly how much each variable contributes to a specific patient’s prediction. This analysis revealed that the importance of different factors shifts as a patient ages. In the earlier stages of the disease, functional scores like the North Star Ambulatory Assessment are highly influential in predicting the next several months of mobility. However, as a patient approaches the loss of ambulation, the fat fraction in the muscles becomes the dominant predictor. This discovery is vital for clinical interpretation because it tells physicians that they must rely more heavily on imaging markers as the disease progresses, as functional tests may lose their sensitivity once a certain level of muscle damage has occurred. Understanding this shifting hierarchy of importance ensures that the model’s predictions are not just accurate, but also biologically plausible and clinically relevant.
Actionable Insights: From the Laboratory to the Patient
The implementation of the DMD-TIMER model as a free, interactive web application transformed this scientific research into a practical resource for the global Duchenne community. This platform allowed clinicians to input specific patient metrics and generate personalized survival curves, which facilitated more nuanced discussions about physical therapy, steroid adjustments, and the timing of home modifications. By enabling “what-if” scenarios, the tool gave families a way to visualize how small improvements in functional scores might extend the predicted duration of mobility. This practical accessibility was a major step forward in democraticizing high-tech medical insights, ensuring that even clinics without dedicated data science teams could benefit from the latest advancements in machine learning. It provided a roadmap for families to navigate the complexities of the disease with greater clarity and less fear of the unknown.
In the final assessment, the development of this tool established a new standard for prognostic care in neuromuscular disorders. The researchers successfully integrated irreversible biological markers of muscle damage with functional performance metrics to create a highly accurate forecasting system. This work concluded that while functional tests remain essential for day-to-day monitoring, quantitative imaging provides the objective evidence necessary for long-term clinical planning. Moving forward, the focus shifted toward automating the MRI segmentation process to make the tool even more efficient and expanding the dataset to include more diverse global populations. The project demonstrated that the strategic use of machine learning could turn overwhelming clinical data into a powerful instrument for personalized medicine, ultimately helping to preserve the quality of life for children living with Duchenne muscular dystrophy.